| PCSIM User Manual |


 |
| PCSIM User Manual |
|
After the simulate command one wants to examin what was going on during the simulation. However we have not yet told to the simulator what we are interested in. In PCSIM this is done by connecting so called recorders.
In order to record the spikes which are emitted by the neuron we have to create a SpikeTimeRecorder and connect the spiking output of the neuron to it:
>>> st_rec_handle = net.record( nrn_handle, SpikeTimeRecorder() )
To record the membrane potetial we have to create a AnalogRecorder and connect the membrane potential to it.
>>> vm_rec_handle = net.record( nrn_handle, "Vm", AnalogRecorder() )
And similarly for the postsynaptic current of the synapse:
>>> ps_rec_handle = net.record( syn_handle, "psr", AnalogRecorder() )
Let us do the simulation again, starting at t=0:
   >>> net.reset()
   >>> net.simulate(0.2)
Now the recordes have the stored the parameters of interest. These can now be analysed and plotted. The following code shows how to generate a figure using matplotlib and numpy which is actually a must have when doing serious numeric compuations with python.
>>> from pylab import *
>>> from numpy import *
>>> clf()
>>> dt = net.simParameter().dt.in_sec()
>>> t = arange( 0, 0.2-dt, dt )
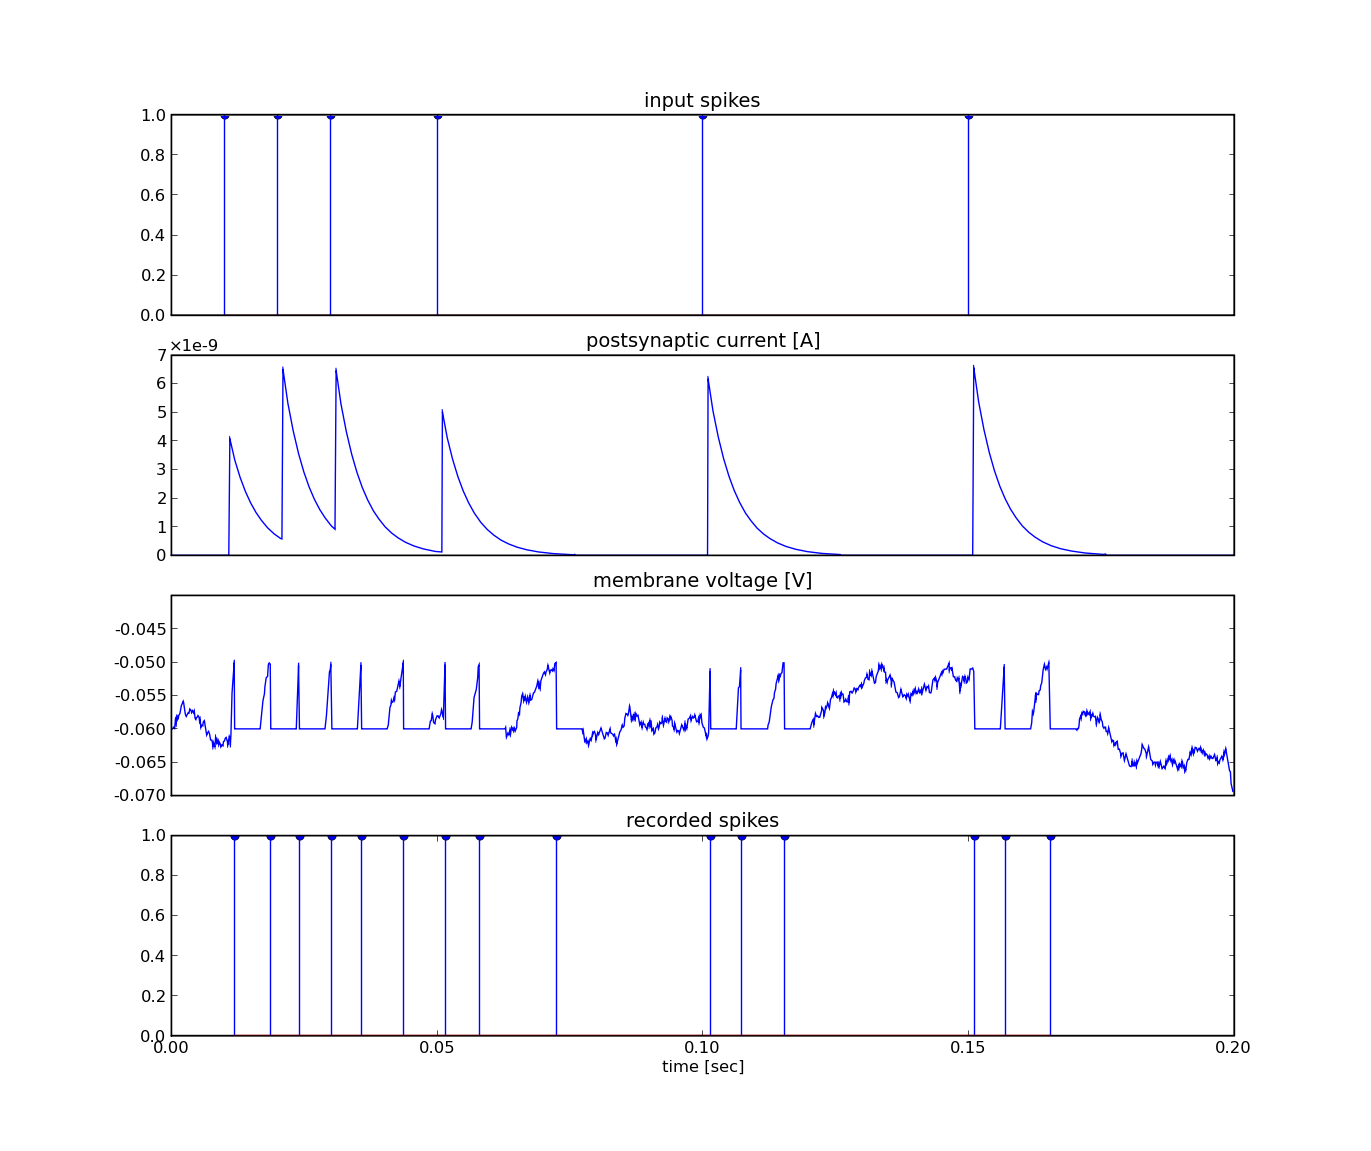
>>> subplot(4,1,1)
>>> stem( input_spike_times, ones_like(input_spike_times) )
>>> xlim( 0, 0.2 ); xticks( [] )
>>> title('input spikes')
>>> subplot(4,1,2)
>>> psc = net.object( ps_rec_handle ).getRecordedValues()
>>> plot( t, psc )
>>> xlim( 0, 0.2 ); xticks( [] )
>>> title('postsynaptic current [A]')
>>> subplot(4,1,3)
>>> vm = net.object( vm_rec_handle ).getRecordedValues()
>>> plot(t,vm)
>>> xlim( 0, 0.2 ); ylim( -0.07, -0.04 ); xticks( [] )
>>> title('membrane voltage [V]')
>>> subplot(4,1,4)
>>> recorded_spike_times = net.object( st_rec_handle ).getSpikeTimes()
>>> stem( recorded_spike_times, ones_like(recorded_spike_times) )
>>> xlim( 0, 0.2 )
>>> xlabel( 'time [sec]' )
>>> title('recorded spikes')
>>> show()
The code above generates the following figure:
   >>> print net.object( nrn_handle ).getVm()
   -0.0620427952915
   >>> print net.object( syn_handle ).psr
   0.0